
STS handles far less traffic than it did, but far more of one kind
Total operations at Sonoma County Airport have halved since 1990. Air Carrier operations are at a record. Both are true of the same airport.
Thirty-six years of FAA counts show every year from 1990 to 2001 busier than every year from 2008 on at Charles M. Schulz – Sonoma County Airport, with itinerant general aviation accounting for most of the fall and Air Carrier operations moving the other way.
By Malcolm Crawford
Two claims about Charles M. Schulz – Sonoma County Airport circulate locally, and they point in opposite directions. One holds that flights have risen sharply. The other holds that the total has barely moved, and treats that as the end of the discussion.
The Federal Aviation Administration has published counts for this airport every year since 1990. Thirty-six complete calendar years are on the record. Both claims can be checked against them — and both can be supported from them, depending on which years are compared and how the figures are drawn.
One term needs settling first. An operation is a single arrival or a single departure, not a round trip, so an airline flight that lands at the airport and later leaves counts as two operations. Overflights, which pass through the airspace without landing, are not counted in the airport totals at all.
The FAA sorts these counts before publishing them. Operations are first split into itinerant and local. Itinerant operations are flights that arrive from outside the airport area, or that depart and leave it. Local operations stay close to the field: aircraft flying the traffic pattern, practicing approaches or low passes, or operating within a designated practice area inside a 20-mile radius of the tower. Itinerant operations are then sorted again, into Air Carrier, Air Taxi, General Aviation, and Military. General Aviation is defined by exclusion: all civil flying that is not Air Carrier or Air Taxi. Air Carrier and Air Taxi both cover flying for hire, whether carrying passengers or cargo, according to the FAA's published glossary. The line the FAA actually draws between them when counting is dealt with later in this piece.
Every year from 1990 to 2001 was busier than every year from 2008 on
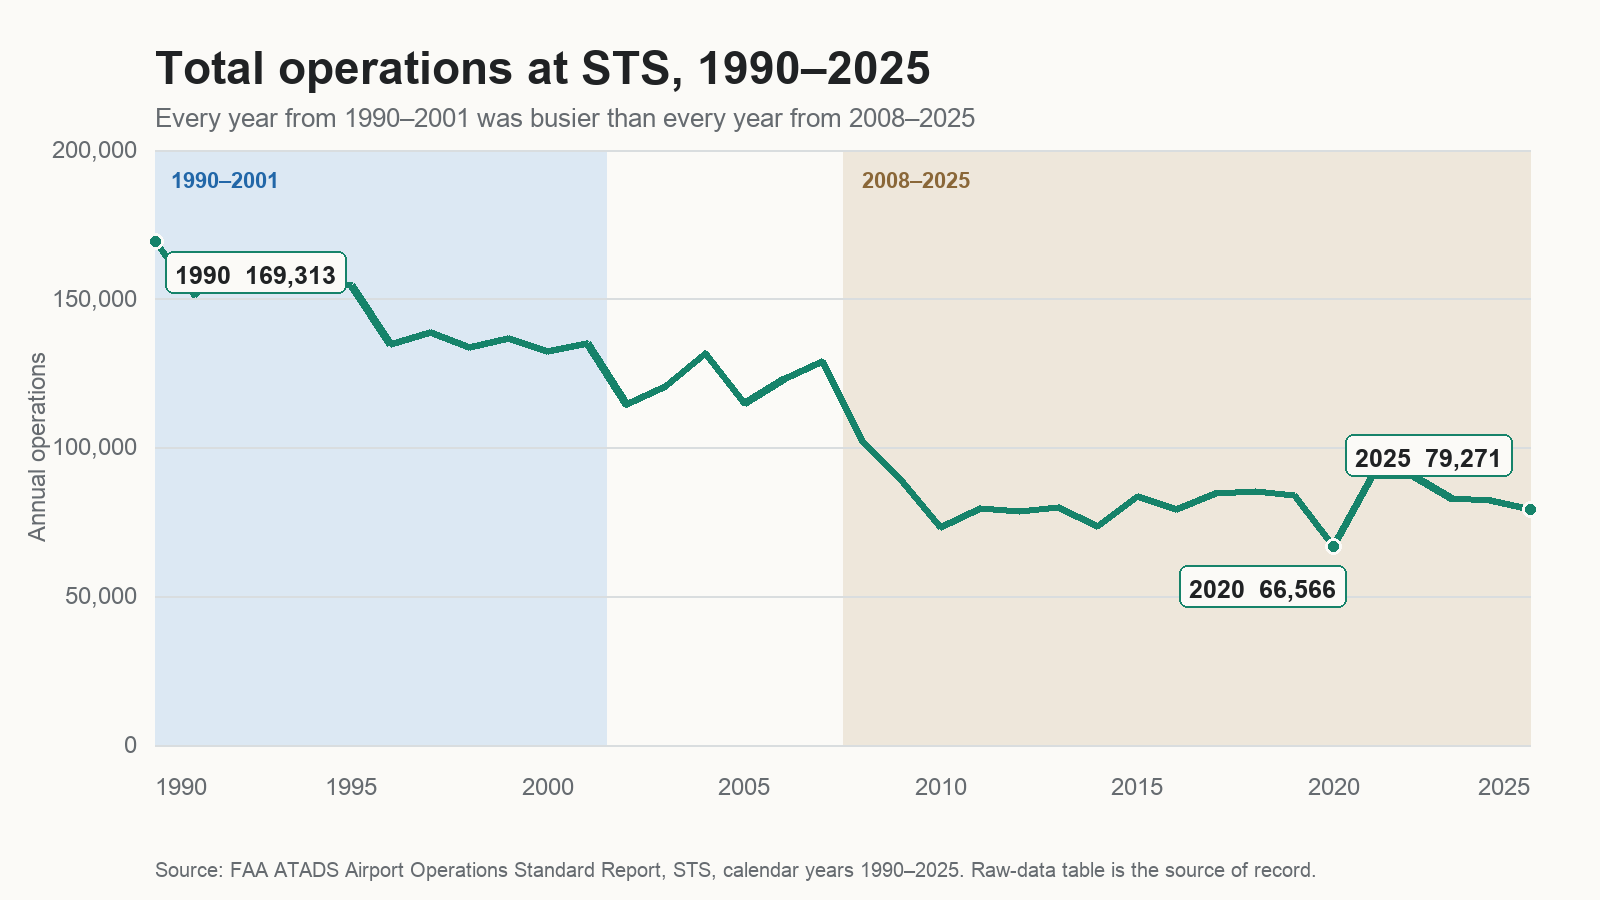
Any two years can be compared, and different pairs give different answers. Reading the whole series does not remove every interpretive choice, but it exposes that sensitivity rather than relying on it, and it shows something a single comparison would miss.
Total operations ran above 132,000 every year from 1990 through 2001. They ran below 103,000 every year from 2008 through 2025. The two sets of figures do not overlap at any point. Between them sit six transition years, from 2002 to 2007, when the total moved through the gap.
That is not a claim about two chosen years. It is a claim about all thirty-six, and no choice of endpoints disturbs it.
The busiest year in this 1990–2025 record is 1990, at 169,313 operations. The quietest is 2020, at 66,566. Since 2010 the total has stayed between 66,566 and 90,742, varying around a level roughly half what it was at the start of the record.
So a claim that the total has barely moved fits the level since about 2010, though not any particular pair of years within it: that stretch contains a swing of more than 24,000 operations. It does not fit the record as a whole. Over thirty-six years the total did not merely fail to rise. It fell a long way, and then settled.
That is not what either claim describes, and it raises a question neither addresses: what fell. A total counts every operation the same way. A decline in it says nothing about which kinds of flying declined, or whether all of them did.
Itinerant general aviation accounts for most of the fall
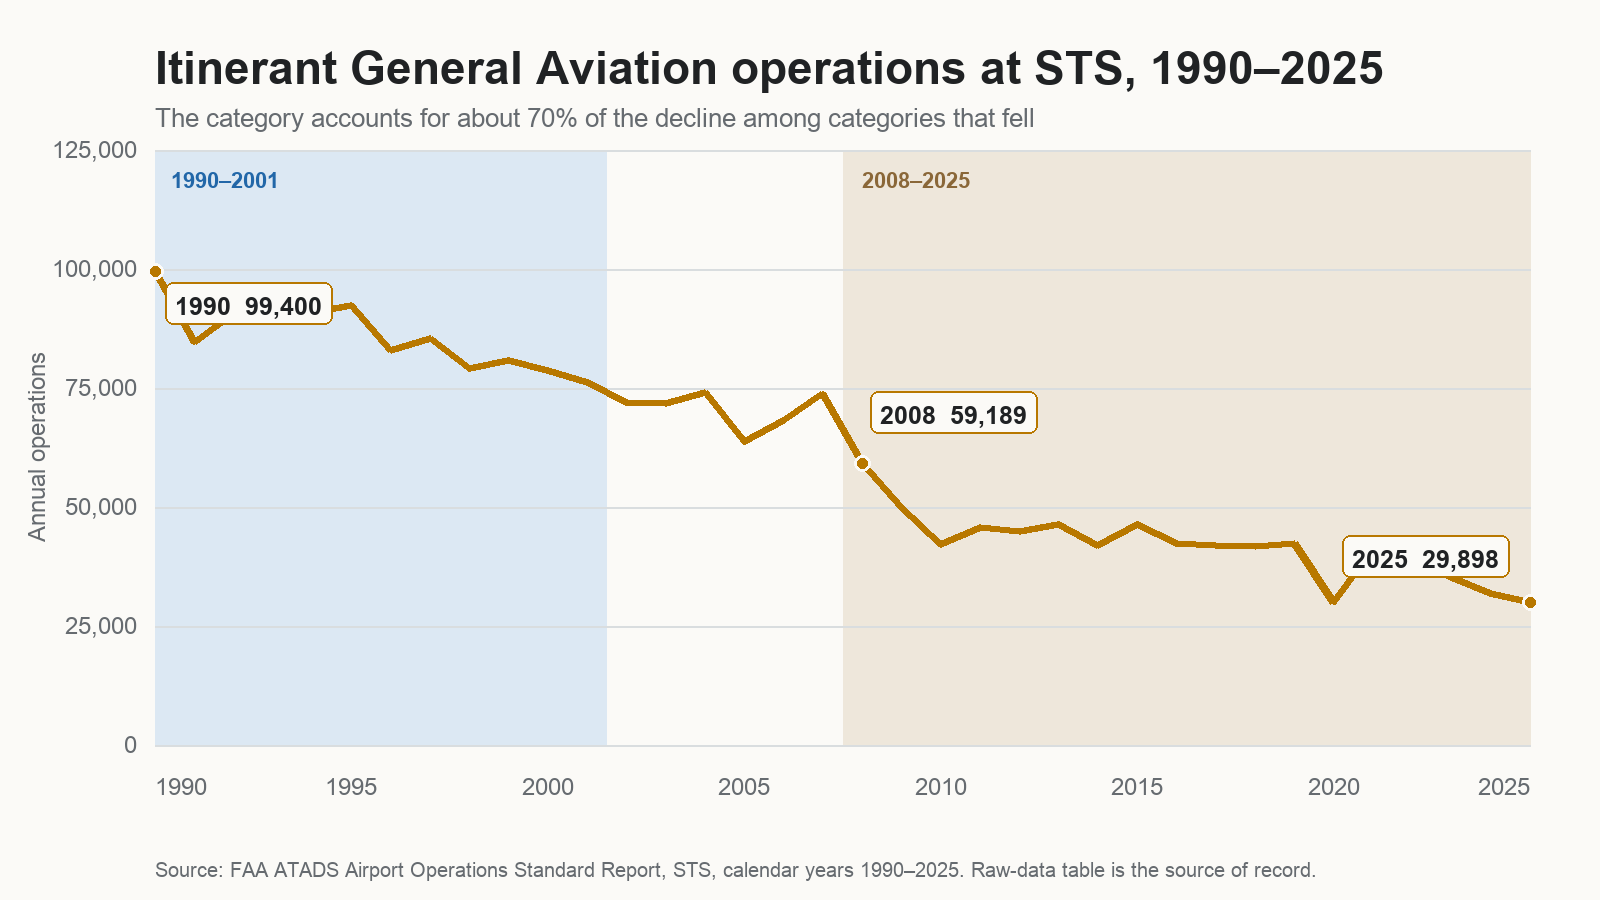
The itinerant General Aviation column separates the same way the total does, and over the same period. It ran above 76,000 every year from 1990 through 2001, and below 60,000 every year from 2008 through 2025. In 1990 the FAA counted 99,400 itinerant general aviation operations at STS. In 2025 it counted 29,898, the lowest figure anywhere in the record. These are itinerant counts only: general aviation flying that stayed in the local pattern is counted separately, under local operations.
Local operations fell alongside it, from above 45,000 every year through 2001 to below 36,000 every year from 2008. That category is broader than it sounds: it covers all civilian local flying, including local flights by air carrier and air taxi aircraft, so it is not a count of light-aircraft training.
Between them, those two categories account for almost the whole of the decline in the total. Of the reduction across all the categories that fell, itinerant general aviation accounts for about seventy percent and local operations for almost all the rest.
Air Carrier operations went the other way
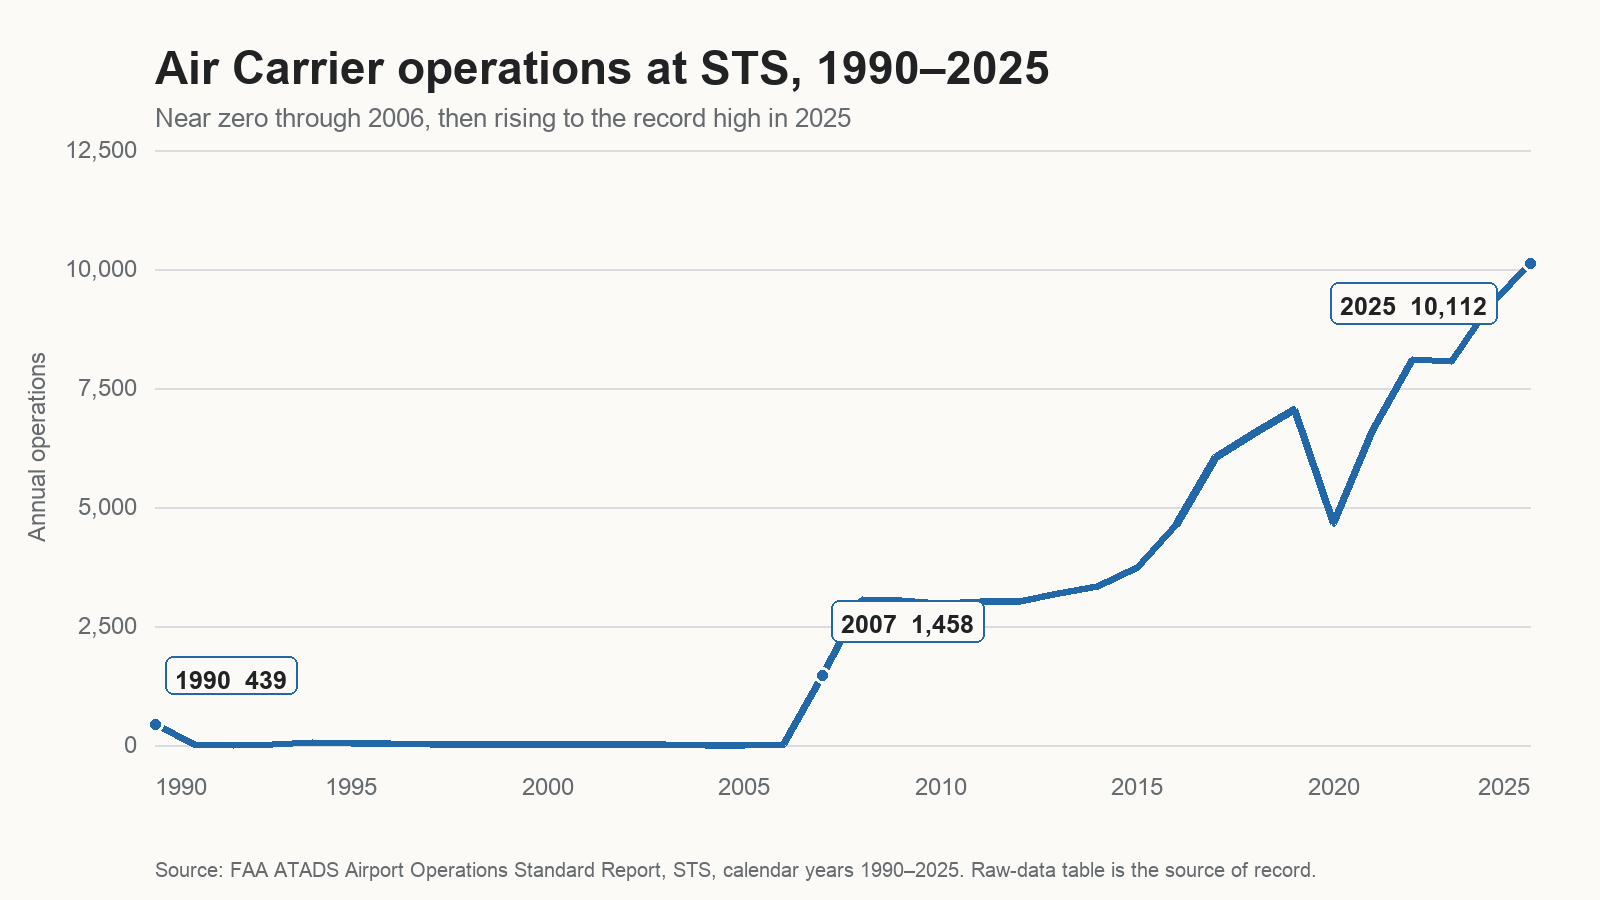
The Air Carrier column is close to empty for the first seventeen years of the record. No year from 1990 through 2006 exceeded 439 operations. In every year from 1991 to 2006 the count was below fifty, and in three of those years it was zero.
From 2008 onward, no year falls below 2,970. The 2025 figure is 10,112, the highest anywhere in the record. Between the two lies a single year: 2007, at 1,458.
The two movements do not share a turning point. Through 2006 the Air Carrier column stays near zero, while the total has already fallen below its 1990s range. The rise begins in 2007, and continues after the total has settled at its lower level.
That growth is given here in operations rather than as a percentage. A rise from 439 to 10,112 can be expressed as a percentage, and the answer would be over two thousand percent, but percentages calculated against a near-zero base describe the base more than the change.
Air Taxi ended where it began, having been somewhere else in between
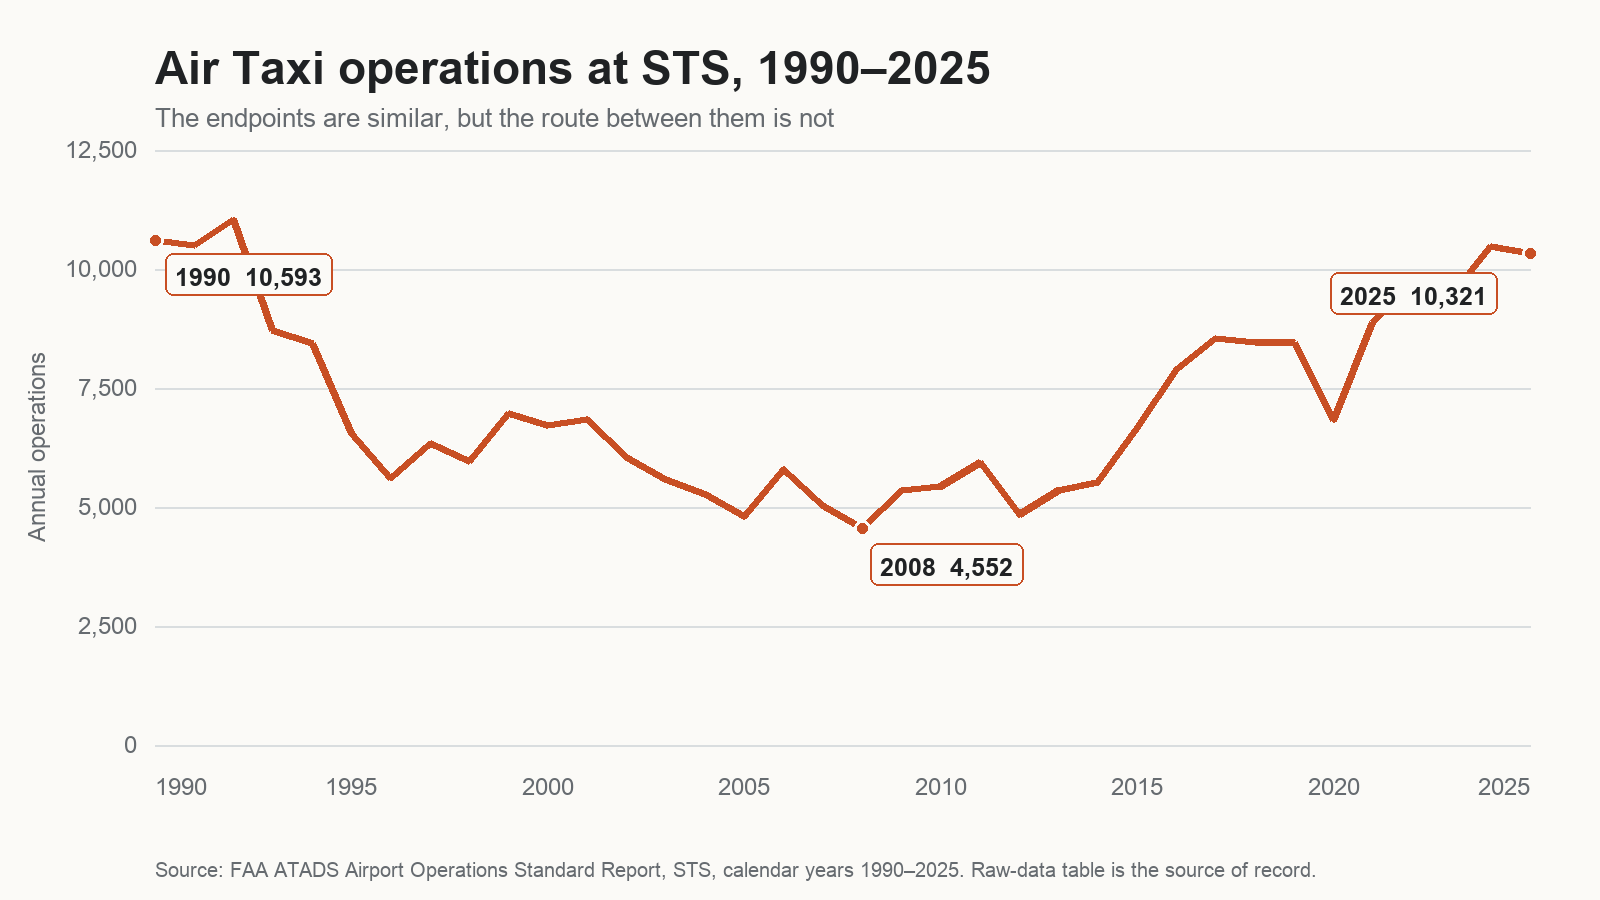
Air Taxi operations were 10,593 in 1990 and 10,321 in 2025. The difference is 272 operations, or 2.6 percent — as close to unchanged as anything in this record.
In 2008 the figure was 4,552, less than half either of those numbers.
A comparison between the first and last years of the record would report that nothing happened to Air Taxi flying at STS. Something did. It fell by more than half and came back, and the two years chosen for the comparison are the two that conceal it.
Nobody is arguing about Air Taxi operations. That is what makes the column useful: it shows what a two-year comparison can miss when there is no motive to miss it.
The airport did not simply get smaller
Together, the movements describe a substantial change in the composition of activity at STS. They do not establish that one category replaced another. The categories that fell lost 99,715 operations between 1990 and 2025; Air Carrier operations gained 9,673, about a tenth as much.
The airport of the 1990s handled between 133,000 and 169,000 operations a year. Most of that was general aviation and local flying. Fewer than 500 operations a year — and in most years fewer than fifty — fell into the Air Carrier category.
The airport of the 2020s handles between 66,000 and 91,000 operations a year. Itinerant General Aviation runs between 29,900 and 41,000, local flying between 24,700 and 33,800, and Air Carrier operations between 4,600 and 10,100 a year.
Both descriptions are accurate. Neither is captured by the total, which fell substantially across the first two decades of the record and says nothing about which categories moved.
A claim about direction depends on the years chosen
Because the total fell across two decades and then leveled, comparisons drawn from it vary enormously with the window. All of the following are correct.
- 1990 to 2025: down 53.2 percent.
- 2000 to 2025: down 40.1 percent.
- 2011 to 2025: down 0.4 percent.
- 2014 to 2025: up 7.7 percent.
- 2020 to 2025: up 19.1 percent.
- 2022 to 2025: down 12.6 percent.
These are illustrations of what the figure permits, not a description of arguments anyone has made. A total-operations comparison reports the choice of years alongside anything that happened at the airport, and a reader given one such comparison has no way to tell how much of it is which.
That applies to the argument set out above as much as to any other. The findings in this piece are stated as separations across the whole series rather than as comparisons between years, for that reason.
The chart below indexes each category to a year of the reader's choosing. Use the index year control to change it: every figure on the chart moves, and 2011 is only the starting position.
STS operations indexed to 2011 = 100
Source: FAA Air Traffic Activity System (ATADS), Airport Operations, complete calendar years 1990–2025. Index years stop at 2023 so every view includes two subsequent years. This chart is derived from the accompanying raw-data table, which is the source of record; if the chart and table ever disagree, use the table.
The category that grew is defined by operator, not by aircraft size
"Air Carrier" is a reporting label, not a plain-English description, and the FAA describes it in two places in two different ways.
The public glossary for these reports describes the categories by aircraft size. Air Carrier covers aircraft with more than 60 seats, or a maximum payload above 18,000 pounds, carrying passengers or cargo for hire. Air Taxi covers aircraft at or below those thresholds, also for hire.
FAA Order JO 7210.3, which instructs facilities on how to record each operation, sorts them by operator instead. There, Air Carrier means operations by aircraft identified at Appendix 3 of that order, which use three-letter company designators. Air Taxi means aircraft not on that list which use three-letter designators or the prefixes "T" or "L". General Aviation is everything civil that remains.
Those are not the same test, and one of them governs. The FAA's own OPSNET documentation states that Order JO 7210.3 establishes the procedures for tabulating and reporting facility air traffic counts. The figures in this piece are therefore best understood as operator-based counts.
That matters for what the growth can be used to say. A rise in the Air Carrier column is a rise in operations by aircraft whose operators appear on the FAA's air carrier designator list. It is not a count of operations by aircraft above any particular size, and it should not be read as one.
"Air Carrier" is also not interchangeable with "commercial operations." Air Taxi operations carry passengers and cargo for hire as well, and they sit in a separate column.
The 2008 reporting change does not account for the separation
The FAA revised its OPSNET counting methodology in 2008, with the new operations reporting taking effect on July 1 of that year. The FAA states that legacy data back to 1990 were standardized to the revised rules, so the series is intended to be internally comparable.
That claim is worth testing against the figures, because the largest single-year fall anywhere in the record is 2007 to 2008, at 26,744 operations. It is larger than the fall after 2001, larger than the fall in the mid-1990s, and larger than the fall in 2020. It also lands exactly on the changeover. Nothing available establishes how much of that drop reflects a change in flying and how much reflects a change in counting.
The separation described above does not depend on resolving that. Leave 2008 out of the record entirely, and every year from 1990 through 2001 still exceeds 132,283 operations while every year from 2009 through 2025 stays below 90,742. The two eras remain distinct with the changeover year removed.
The record shows what changed, and not why
These are counts. They establish what happened to operations at STS between 1990 and 2025, and they establish nothing about the causes.
Nothing here indicates why itinerant general aviation operations fell, or why local flying fell with them. Nothing here indicates why the Air Carrier column was near-empty until 2007 or why it filled afterward. Nothing here establishes what role, if any, the runway extension or any other airport decision played in that growth relative to what would otherwise have occurred. A causal claim in either direction needs evidence these figures do not contain.
The figures are also silent on aircraft types. The FAA categories describe which operators flew, not which aircraft they flew.
Open questions
- Why does the FAA's public glossary describe these categories using aircraft-size thresholds when the counting order that governs OPSNET reporting classifies by operator and designator?
- What accounts for the decline in itinerant general aviation operations, which fell from 99,400 in 1990 to 29,898 in 2025?
- What accounts for the Air Carrier column being near-empty until 2006, and for its filling from 2007?
- What is the composition of local operations, and how much of that category is flown by air carrier or air taxi aircraft?
- What aircraft types make up the Air Carrier and Air Taxi categories at STS, and is that breakdown published anywhere?
A note on the charts
The four charts above use different vertical scales, because the categories differ greatly in size. Slopes are not comparable between them. The fall in itinerant general aviation operations between 1990 and 2025 is 69,502; the rise in Air Carrier operations over the same span is 9,673. The general aviation line represents a movement more than seven times larger, though the two lines look similar.
Sources
Federal Aviation Administration, Air Traffic Activity Data System (ATADS), Airport Operations Standard Report, Facility STS, January 1990 – December 2025, retrieved August 25, 2026. The complete year-by-year series, the query specification, and the category definitions and caveats governing these figures are published at FAA airport operations counts for STS, 1990–2025.
Federal Aviation Administration, ASPMHelp, "OPSNET Reports: Definitions of Variables."
Federal Aviation Administration, ASPMHelp, "Operations Network (OPSNET)" — for the 2008 methodology revision, the standardization of legacy data, and the statement that Order JO 7210.3 establishes the procedures for tabulating and reporting facility air traffic counts.
Federal Aviation Administration, Order JO 7210.3EE, Facility Operation and Administration, Chapter 13, Section 1, paragraph 13-1-5.
Colophon: researched and drafted in collaboration with Claude (Anthropic).